HeadsUp: simplifying predictive scoring for sales teams
HeadsUp: simplifying predictive scoring for sales teams
HeadsUp: simplifying predictive scoring for sales teams
At HeadsUp, I led product design from the ground up — from defining early concepts to shipping a self-serve machine learning scoring feature. This summarized case study covers how I translated complex ML logic into an intuitive, flexible workflow — making advanced tooling usable for non-technical teams.
At HeadsUp, I led product design from the ground up — from defining early concepts to shipping a self-serve machine learning scoring feature. This summarized case study covers how I translated complex ML logic into an intuitive, flexible workflow — making advanced tooling usable for non-technical teams.
Role
Product designer
Product designer
Timeline
3 months
3 months
Team
Founders, Product Managers, Engineers, Data Scientists, and Go-To-Market — across time zones in a fully remote setup
Founders, Product Managers, Engineers, Data Scientists, and Go-To-Market — across time zones in a fully remote setup
What I worked on
User research & workflow mapping
Designing features end-to-end
Driving cross-functional collaboration
User research & workflow mapping
Designing features end-to-end
Driving cross-functional collaboration
HeadsUp, founded in 2021 in the United States, is a Machine Learning-powered platform that helps B2B sales revenue teams score and prioritise leads based on product usage data.
HeadsUp, founded in 2021 in the United States, is a Machine Learning-powered platform that helps B2B sales revenue teams score and prioritise leads based on product usage data.

HeadsUp: AI conversion engine for product-led growth
HeadsUp: AI conversion engine for product-led growth
HeadsUp: AI conversion engine for product-led growth


Problem
Problem
In early versions of the product, scoring existed only as a backend output — surfaced in the UI as a raw number with no context, explanation, or ability to adjust. There was no way for users to interpret how scores were calculated or influence how they worked. While this bare-minimum version provided some value, it limited adoption and trust.
In early versions of the product, scoring existed only as a backend output — surfaced in the UI as a raw number with no context, explanation, or ability to adjust. There was no way for users to interpret how scores were calculated or influence how they worked. While this bare-minimum version provided some value, it limited adoption and trust.
As usage grew, we began hearing consistent feedback from customers: they wanted more control, transparency, and actionable insight from scoring. These limitations were holding back go-to-market scalability and preventing the product from realizing its full potential.
As usage grew, we began hearing consistent feedback from customers: they wanted more control, transparency, and actionable insight from scoring. These limitations were holding back go-to-market scalability and preventing the product from realizing its full potential.

Revenue teams needed to customize and trust ML-powered scoring, but were blocked by technical dependencies, lack of transparency, and inability to scale independently.
Revenue teams needed to customize and trust ML-powered scoring, but were blocked by technical dependencies, lack of transparency, and inability to scale independently.
Revenue teams needed to customize and trust ML-powered scoring, but were blocked by technical dependencies, lack of transparency, and inability to scale independently.

Outcome
Outcome
I designed an end-to-end experience that enabled sales teams to create, configure, and monitor predictive models directly within the app.
I designed an end-to-end experience that enabled sales teams to create, configure, and monitor predictive models directly within the app.
I'm proud of this project not just because of its complexity, but because I saw it through from zero to one — shaping the product alongside engineering from the earliest infrastructure decisions to launch. I learned how to work closely with machine learning systems, navigate real-world constraints, and design for both power and clarity.
I'm proud of this project not just because of its complexity, but because I saw it through from zero to one — shaping the product alongside engineering from the earliest infrastructure decisions to launch. I learned how to work closely with machine learning systems, navigate real-world constraints, and design for both power and clarity.
Discovery & Research
Discovery & Research
To validate the problem space and define requirements, I took a multi-pronged approach:
To validate the problem space and define requirements, I took a multi-pronged approach:

User Research
User Research
Interviewed 50+ sales reps and customers to uncover how they used scoring in their workflow, and where friction emerged in extracting value from our current system.
Interviewed 50+ sales reps and customers to uncover how they used scoring in their workflow, and where friction emerged in extracting value from our current system.
Competitor Analysis
Competitor Analysis
Analyzed 12 tools to identify best practices in surfacing complex logic — from how data-heavy platforms explain scores to non-technical users, to UI patterns that balance simplicity and transparency.
Analyzed 12 tools to identify best practices in surfacing complex logic — from how data-heavy platforms explain scores to non-technical users, to UI patterns that balance simplicity and transparency.
Technical Exploration
Technical Exploration
Partnered closely with data scientists and engineers to understand model constraints, identify which parameters could be safely exposed, and define what user feedback mechanisms were technically feasible.
Partnered closely with data scientists and engineers to understand model constraints, identify which parameters could be safely exposed, and define what user feedback mechanisms were technically feasible.

Key findings
Key findings
#1
#1
🧠 Mental Model Mismatch
🧠 Mental Model Mismatch
Sales teams think in buyer intent; data teams think in statistical signals. We needed to bridge the gap between technical logic and sales narrative.
Sales teams think in buyer intent; data teams think in statistical signals. We needed to bridge the gap between technical logic and sales narrative.
#2
#2
📐 The “3-Decision” Rule
📐 The “3-Decision” Rule
Effective self-serve tools avoid overwhelming users with more than 3 key decisions at a time.
Cognitive load = adoption barrier.
Effective self-serve tools avoid overwhelming users with more than 3 key decisions at a time.
Cognitive load = adoption barrier.
#3
#3
🧩 One Size Doesn’t Fit All
🧩 One Size Doesn’t Fit All
User personas ranged from data-savvy to non-technical users. We needed to design for flexibility and inclusiveness
User personas ranged from data-savvy to non-technical users. We needed to design for flexibility and inclusiveness
Design Principles
Design Principles
Grounded in user research, technical constraints, and our strategic vision, these six principles guided every design decision:
Grounded in user research, technical constraints, and our strategic vision, these six principles guided every design decision:
#1
#1
Guided Complexity
Guided Complexity
Break down multi-layered processes into manageable, intuitive steps that align with how users think.
Break down multi-layered processes into manageable, intuitive steps that align with how users think.
#2
#2
Business-First Language
Business-First Language
Prioritize language and framing that aligns with users’ workflows, not the underlying ML system.
Prioritize language and framing that aligns with users’ workflows, not the underlying ML system.
#3
#3
Educational Layering
Educational Layering
Provide layered support through contextual explanations, not upfront training or heavy documentation.
Provide layered support through contextual explanations, not upfront training or heavy documentation.
#4
#4
Continuous Feedback
Continuous Feedback
Provide real-time feedback to help users understand the impact of their actions.
Provide real-time feedback to help users understand the impact of their actions.
#5
#5
Modular Thinking
Modular Thinking
Design components as flexible, independent building blocks that can be recombined as needs evolve.
Design components as flexible, independent building blocks that can be recombined as needs evolve.
#6
#6
Future Proofing
Future Proofing
Make decisions today that won’t limit us tomorrow—especially in how we handle data, features, and scale.
Make decisions today that won’t limit us tomorrow—especially in how we handle data, features, and scale.
Design Goal & Approach:
Design Goal & Approach:
Framing Model Output for Trust & Action
Framing Model Output for Trust & Action
To make predictive scores usable for sales teams, I focused on two key design dimensions:
To make predictive scores usable for sales teams, I focused on two key design dimensions:
#1
#1
Score Framing — Aligning output to user interpretation
Score Framing — Aligning output to user interpretation
Raw numeric scores offered transparency, but often led to false precision and decision paralysis. I moved toward score buckets (e.g. High / Medium / Low) that helped users focus on prioritization, not decimal differences — especially critical in fast-paced triage workflows
Raw numeric scores offered transparency, but often led to false precision and decision paralysis. I moved toward score buckets (e.g. High / Medium / Low) that helped users focus on prioritization, not decimal differences — especially critical in fast-paced triage workflows
#2
#2
Signal Display – Communicating model rationale at a glance
Signal Display – Communicating model rationale at a glance
Multiplier weights were statistically accurate but cognitively heavy. Narrative explanations added trust but lacked scalability. I landed on simple visual arrows to highlight top signals — intuitive, lightweight, and reinforced that these are influencers, not absolute truths.
Multiplier weights were statistically accurate but cognitively heavy. Narrative explanations added trust but lacked scalability. I landed on simple visual arrows to highlight top signals — intuitive, lightweight, and reinforced that these are influencers, not absolute truths.

Feature #1: Setting Up a Scoring Model
Feature #1: Setting Up a Scoring Model
To help go-to-market teams build tailored scoring models without needing a data science degree, we designed a guided three-step setup flow. In Step 1, users select which accounts to learn from and set a relevant lookback window. In Step 2, they define what conversion means for their business by applying filters — with immediate preview feedback to validate accuracy. Step 3 allows users to optionally exclude noise or edge-case events that might hurt model quality. The wizard format provided clarity and pacing, making setup approachable yet powerful.
To help go-to-market teams build tailored scoring models without needing a data science degree, we designed a guided three-step setup flow. In Step 1, users select which accounts to learn from and set a relevant lookback window. In Step 2, they define what conversion means for their business by applying filters — with immediate preview feedback to validate accuracy. Step 3 allows users to optionally exclude noise or edge-case events that might hurt model quality. The wizard format provided clarity and pacing, making setup approachable yet powerful.

Feature #2 – Engaging with Model Outputs
Feature #2 – Engaging with Model Outputs
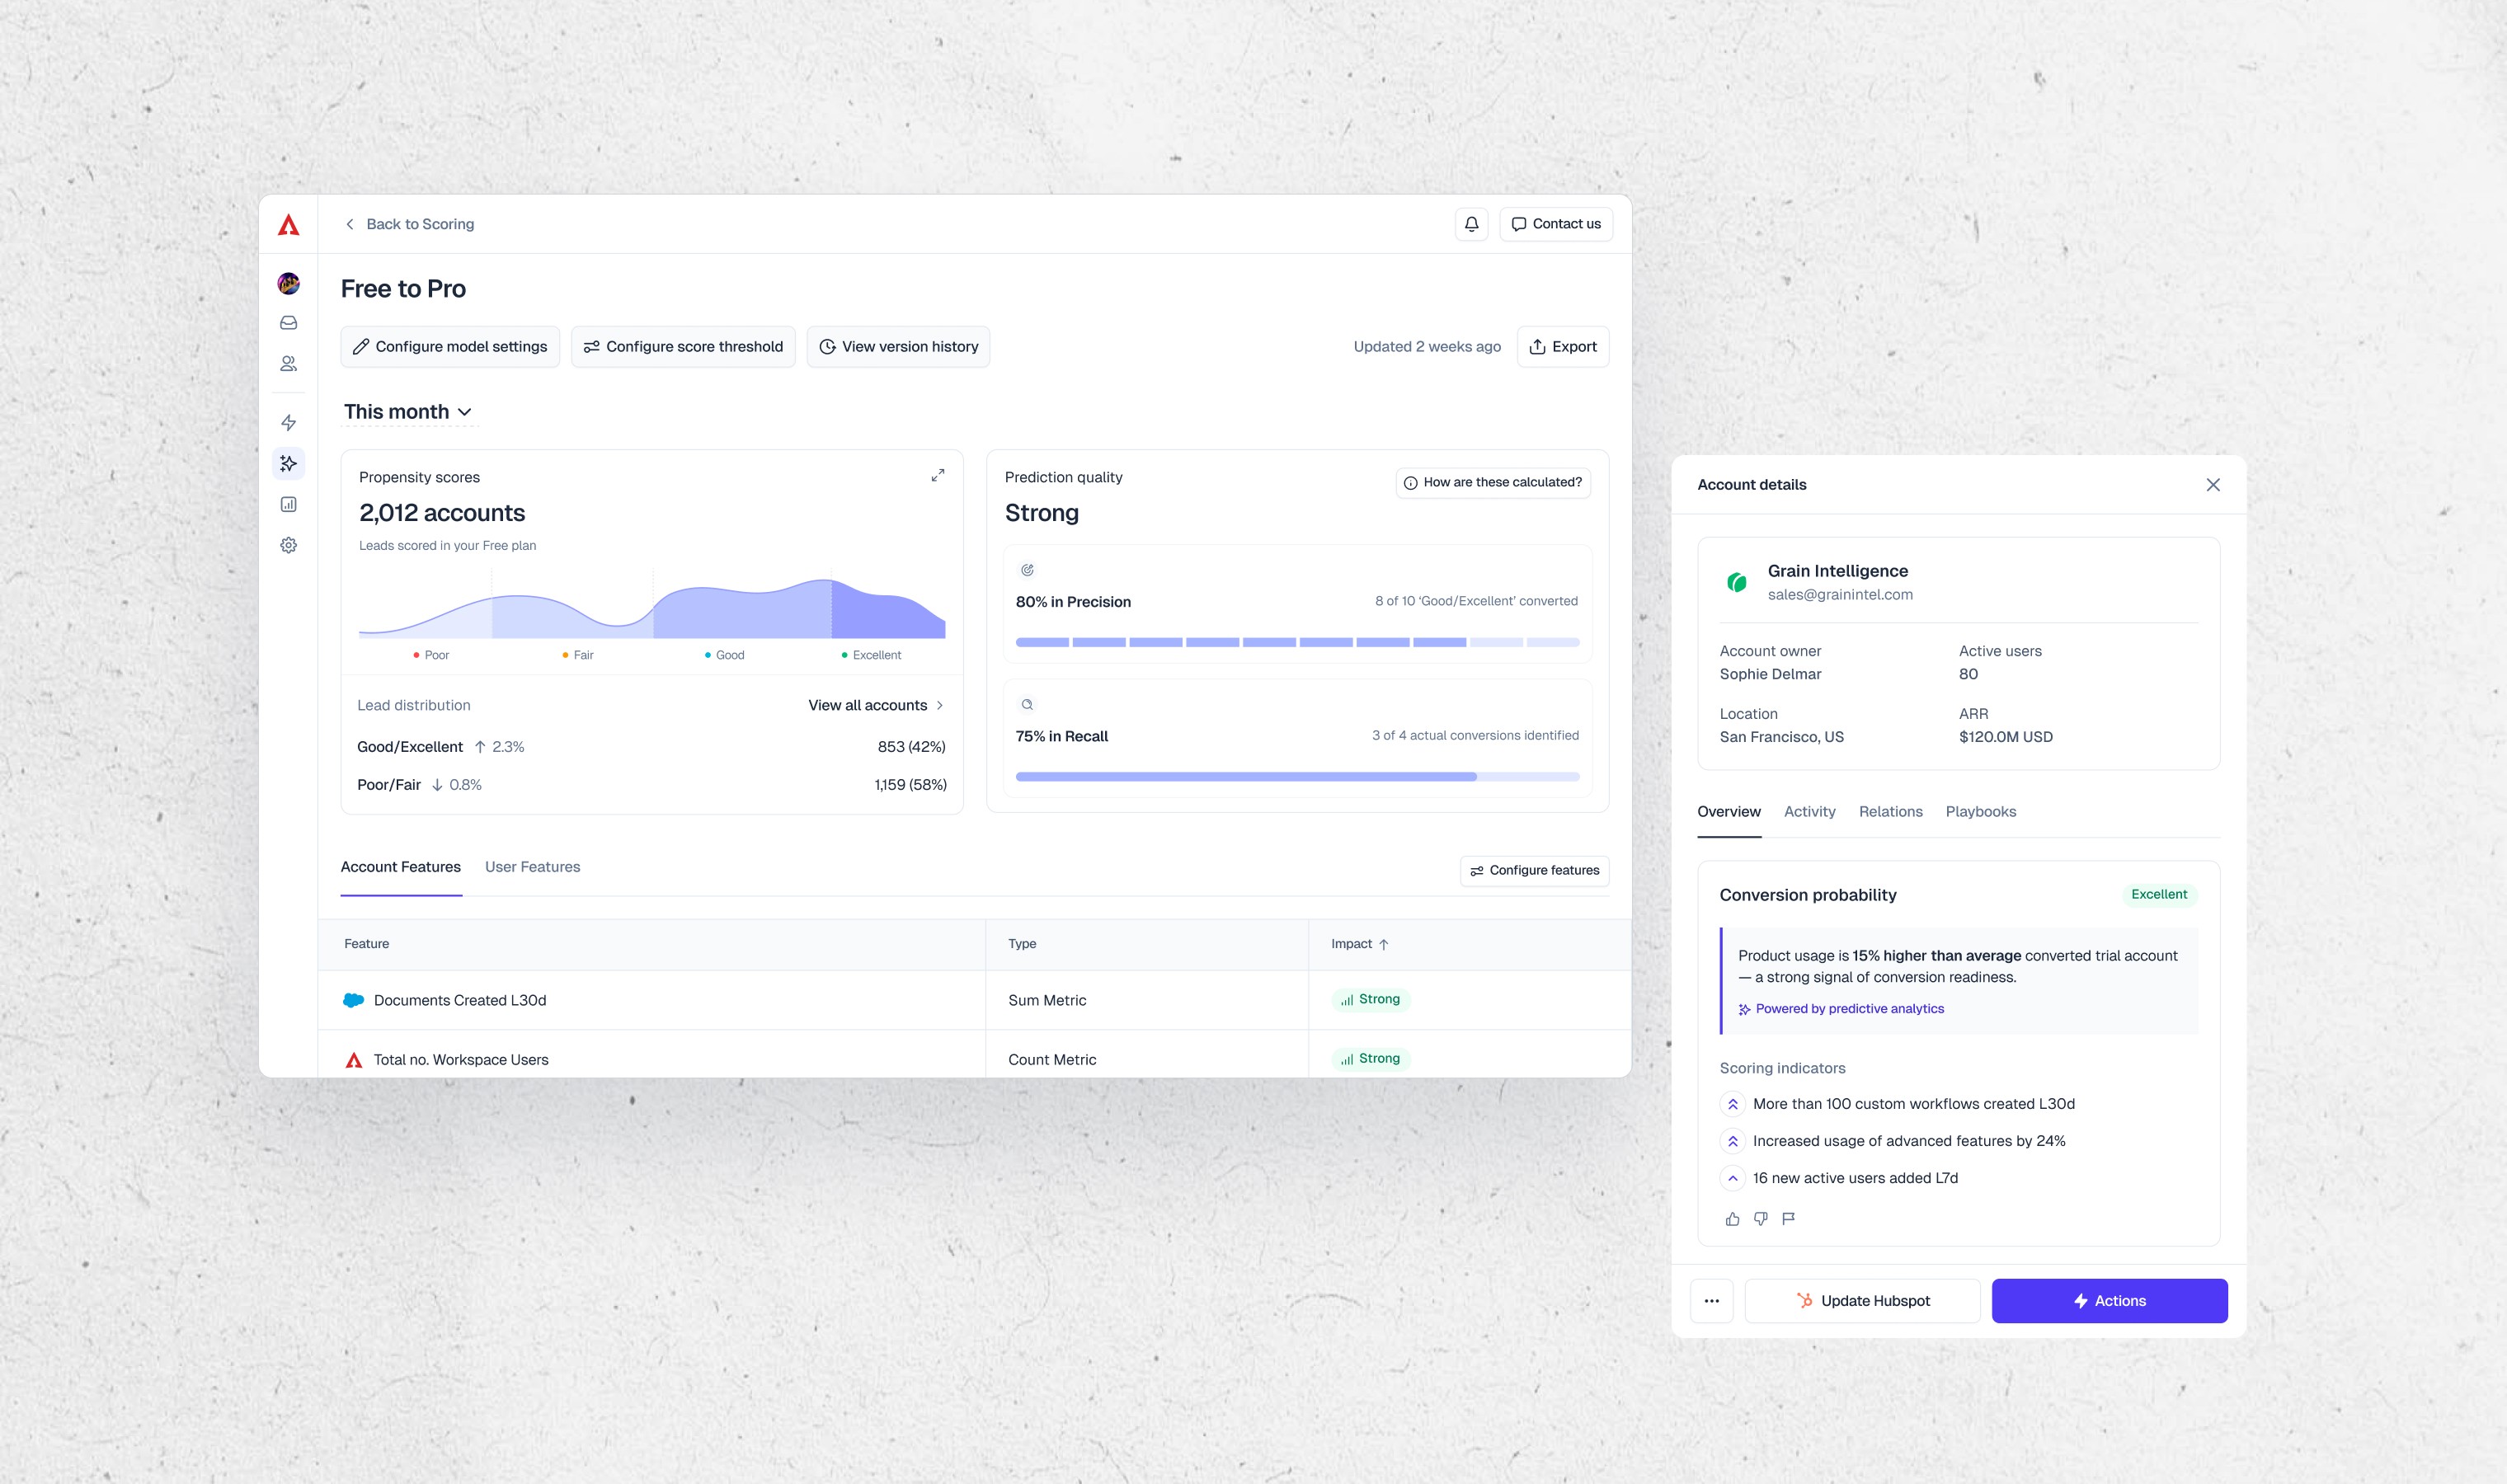
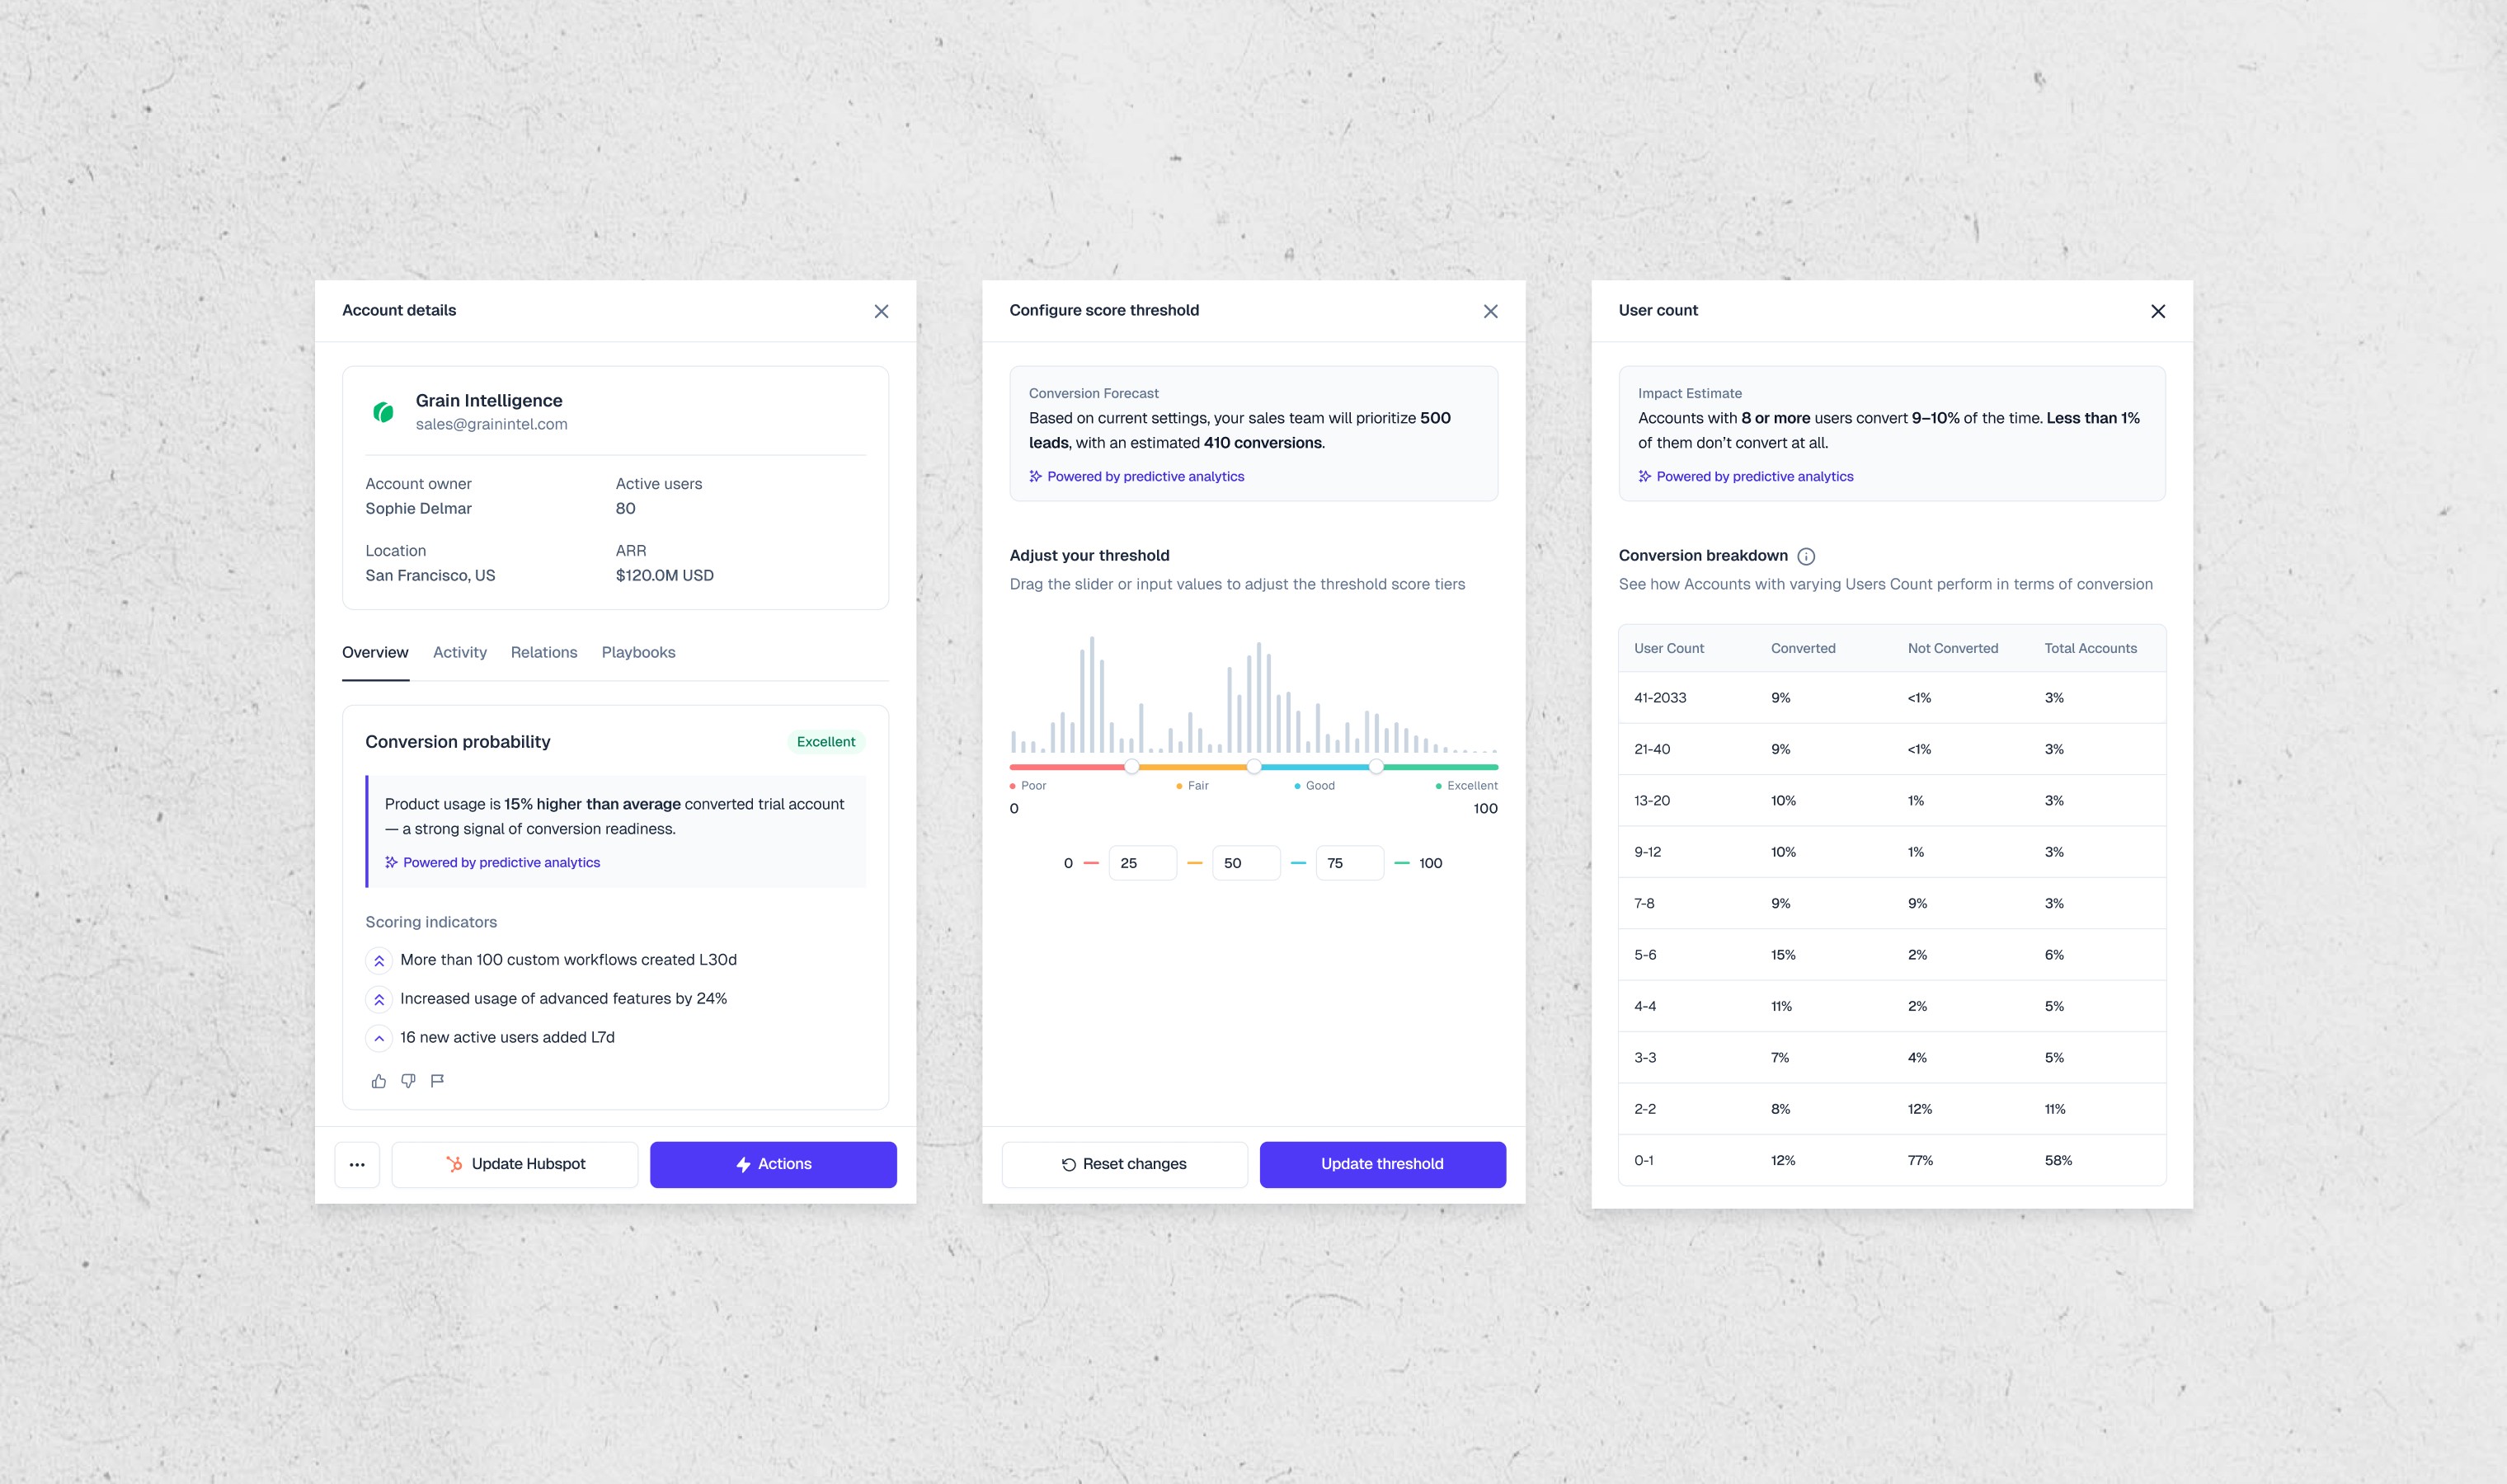
I brought scoring insights to the core of daily workflows through the customer segment table. Users can access a 360° side panel to view account context and review their ML score card. The score card highlights the top three behavioral signals driving each score, giving transparency to the model’s reasoning. A lightweight feedback mechanism also lets users rate or flag questionable insights, enabling a human-in-the-loop system. This view became the primary touchpoint for users to interact with and refine the model in real time.
I brought scoring insights to the core of daily workflows through the customer segment table. Users can access a 360° side panel to view account context and review their ML score card. The score card highlights the top three behavioral signals driving each score, giving transparency to the model’s reasoning. A lightweight feedback mechanism also lets users rate or flag questionable insights, enabling a human-in-the-loop system. This view became the primary touchpoint for users to interact with and refine the model in real time.

Feature #3: Monitoring Model Performance
Feature #3: Monitoring Model Performance
The monitoring dashboard was designed to answer a critical user question: “Is this working?” Key performance metrics like precision, recall, and coverage are surfaced immediately for quick assessments. Expandable sections let users drill into model outputs — such as feature lift and prediction distribution — without overwhelming the interface. Power users can edit key model inputs directly from the dashboard, enabling iteration without disruption. This progressive disclosure approach supported both rapid scanning and in-depth diagnostics.
The monitoring dashboard was designed to answer a critical user question: “Is this working?” Key performance metrics like precision, recall, and coverage are surfaced immediately for quick assessments. Expandable sections let users drill into model outputs — such as feature lift and prediction distribution — without overwhelming the interface. Power users can edit key model inputs directly from the dashboard, enabling iteration without disruption. This progressive disclosure approach supported both rapid scanning and in-depth diagnostics.

Results & impact
Results & impact
The impact was tangible: we shortened onboarding time by 60%, reduced support tickets by 45%, and drove a 30% boost in ARR by increasing PoC conversions. By Q4 2023, the product helped close 25% more deals — ultimately contributing to our acquisition by Hightouch.
The impact was tangible: we shortened onboarding time by 60%, reduced support tickets by 45%, and drove a 30% boost in ARR by increasing PoC conversions. By Q4 2023, the product helped close 25% more deals — ultimately contributing to our acquisition by Hightouch.

